


Hybrid View
-
05-12-2017 06:46 AM #1
- Ngày tham gia
- Mar 2016
- Đang ở
- https://nguyenphuochai.vn/
- Bài viết
- 2,011
- Được cám ơn 3 lần trong 3 bài gởi

Thời gian Báo cáo: 05-thg 12-2017 00:14 EET
Báo cáo Thị trường được tạo 3 lần mỗi ngày trước khi mở cửa tại Tokyo, London và New York. Các báo cáo này cung cấp cho bạn một cái nhìn tổng quan về triển vọng kỹ thuật của thị trường trước khi mở của các trung tâm tài chính lớn.
Biến động thị trường cho thấy sự thay đổi giá cả từ cùng một báo cáo 24 giờ trước đó.
Hỗ trợ RSI và Đường trung bình Biến động là 34 nến TP: Điểm Chuyển Cuối – được sử dụng để xác định Mức Hỗ trợ (SL) và Kháng cự (RL)
EUR/USD
17-thg 11-08:00 -> 05-thg 12-00:00 Mức đích: 1.1940
SL: (A) 1.1829 TP cuối cùng của Mô hình Tam giác
RL: (B) 1.1940 TP cuối cùng của Mô hình Tam giác
Khoảng đích: 4 ngày
Khoảng 1 giờ
Mô hình Mô hình Tam giác
Chiều dài 223 nến
Xác định 04-thg 12-23:00
Mô hình Tam giác được xác định tại 04-thg 12-23:00. Mô hình này vẫn đang trong quá trình hình thành. Biến động giá có khả năng tăng hướng tới kháng cự 1.1940 trong vòng 4 ngày tiếp theo.

Xem thêm các cặp khác:
Code:http://chienluoc100pip.com/market-report-phien-chau-a-ngay-5-12-2017/
Website : https://nguyenphuochai.vn//
Mở TK HotForex: https://www.hotforex.com/?refid=116627
Mở TK Axitrader: https://goo.gl/iTGLce
Mobile : 0908950768 - Zalo - Viber
Không chia sẽ là hủy diệt- Sơn SVT
Tâm trạng không tốt-không trade ; thể trạng không khỏe -không trade
-
14-12-2017 08:56 AM #2
- Ngày tham gia
- Mar 2016
- Đang ở
- https://nguyenphuochai.vn/
- Bài viết
- 2,011
- Được cám ơn 3 lần trong 3 bài gởi
Chart Art: Long-Term Trends on AUD/JPY and EUR/AUD
It’s all about the Aussie on today’s canvas, as I bring to you long-term trend opportunities on AUD/JPY and EUR/AUD. Check ’em out while they’re hot!
AUD/JPY recently bounced from the 84.50 psychological handle, which was right smack at a rising channel support on the 4-hour time frame. Think the bulls have enough juice to push it back to the 91.00 – 91.50 previous highs?
If you think they do, then you could buy at current levels and place your stops just below the channel for a good reward-to-risk ratio. Watch out for the 87.00 mid-channel resistance though! With stochastic already near the overbought territory, the bears could set camp at the nearest area of interest and try to drag the pair back down.
For those who are planning on trading this setup, remember to keep your stops wide. Remember that yen crosses like these tend to see volatility like nobody’s business!
Here’s another one for the trend warriors out there! EUR/AUD encountered resistance at the 1.5700 psychological handle and is fast approaching the 1.5350 area. BFD, since the level is near a 61.8% Fib retracement, previous resistance, AND a rising trend line that hasn’t been broken since early February.
Will the euro see another leg higher against the Aussie? With stochastic about to hit the oversold region, you can bet your pips that the bulls are already watching this one. Buying around the 1.5300 area could get you a sweet deal especially if you place your stops just below the trend line and aim for the previous 1.5700 previous highs.
If you think that the euro will end the year by breaking the uptrend, though, then you could also place your orders below the trend line and wait for legit breakout signs before trading a possible reversal.
Good luck and good trading, brothas!
Forex Chart Settings:
Slow Stochastic: 14,3,3
100 SMA: Blue line
200 SMA: Red line
Chiến lược giao dịch với Stochastic Oscillator
Code:http://chienluoc100pip.com/chien-luoc-giao-dich-voi-stochastic-oscillator/
Website : https://nguyenphuochai.vn//
Mở TK HotForex: https://www.hotforex.com/?refid=116627
Mở TK Axitrader: https://goo.gl/iTGLce
Mobile : 0908950768 - Zalo - Viber
Không chia sẽ là hủy diệt- Sơn SVT
Tâm trạng không tốt-không trade ; thể trạng không khỏe -không trade
-
21-12-2017 09:23 AM #3
- Ngày tham gia
- Mar 2016
- Đang ở
- https://nguyenphuochai.vn/
- Bài viết
- 2,011
- Được cám ơn 3 lần trong 3 bài gởi
Intraday Charts Update: Revisiting Old Setups On AUD/JPY& AUD/USD
This would probably be the final intraday charts update of 2017. With that said, let’s take a stroll down memory lane as we check up on our old setups on AUD/JPY and AUD/USD. And as always, we’ll be lookin’ for fresh plays as well.
Back on December 15, we noted that AUD/USD appeared to be hesitating at 0.7690. We therefore expected the pair to pull back. And we setup a Fibonacci retracement play so that we can find an opportunity to jump in with a long.
Well, the pair did pull back. But as y’all can see, the pair then opted to trade sideways, forming that there fresh symmetrical triangle in the process. However, the chart pattern also looks like a bullish pennant if we also take into account the bullish surge before the pair began consolidating.
If what we’re lookin’ at is a pennant, then our main directional bias is to the upside. And we’re waiting for a clear break past 0.7690, with the expectation that the resulting rally will likely have enough momentum for a 190-pip move.
But if that there is a symmetrical triangle, then we still have the same upside expectations. However, a symmetrical triangle also has a chance of breaking to the downside, so it may be prudent to prepare for a downside scenario, especially if the pair takes out 0.7640, since that would validate the downside break.
If y’all can still recall, we found an ascending triangle on AUD/JPY’s 1-hour chart in yesterday’s intraday charts update.
Well, that broke to the upside as expected, which is pretty dope. However, the pair quickly found resistance at 86.90. There’s therefore a good chance that the pair will pull back before resuming its upward push.
And using our Fibonacci tool, we can see the the 50% retracement level is the key pullback area to watch since it’s just below the broken resistance area at 0.8650. And if the pair does retrace and 0.8650 holds as support, then them bulls will likely be gunning for 87.60 next.
Do note, however, that if the retracement is much deeper and moves lower past 86.00, then that ain’t a retracement no more. In fact, that’s an early sign of a trend change, so y’all may wanna bail yo long if you still have ’em then.
In any case, just remember to always practice proper risk management, a’ight?
Forex Chart Settings:
Slow Stochastic: 14,3,3
100 SMA: Blue line
200 SMA: Red line
Chiến lược giao dịch với Stochastic Oscillator
Code:http://chienluoc100pip.com/chien-luoc-giao-dich-voi-stochastic-oscillator/
Website : https://nguyenphuochai.vn//
Mở TK HotForex: https://www.hotforex.com/?refid=116627
Mở TK Axitrader: https://goo.gl/iTGLce
Mobile : 0908950768 - Zalo - Viber
Không chia sẽ là hủy diệt- Sơn SVT
Tâm trạng không tốt-không trade ; thể trạng không khỏe -không trade
-
03-01-2018 11:03 AM #4
- Ngày tham gia
- Mar 2016
- Đang ở
- https://nguyenphuochai.vn/
- Bài viết
- 2,011
- Được cám ơn 3 lần trong 3 bài gởi
Chiến lược MUA ĐÁY BÁN ĐỈNH ngày 3-1-2018

Bởi chúng ta không thể sống mãi mãi, hãy để lại cho hậu thế điều gì đó ghi dấu rằng ta đã sống.

Video Chiến lược MUA ĐÁY BÁN ĐỈNH ngày 3-1-2018
https://www.youtube.com/watch?v=Hp_kLoAnsmc
Mở tài khoản để trải nghiệm tại ForexTime: https://goo.gl/G8tB6Q
Mở tài khoản Micro để trải nghiệm tại Weltrade: https://goo.gl/DdGNdW
Mở tài khoản để Trade Coin tại Pepperstone: https://goo.gl/e1y30J
Mở tài khoản Axitrader – VSG lần I : https://goo.gl/iTGLce
Mở tài khoản FXPro Master IB VangSaiGon : https://goo.gl/Yz9kk3
Dự báo Tin tức cơ bản hôm nay
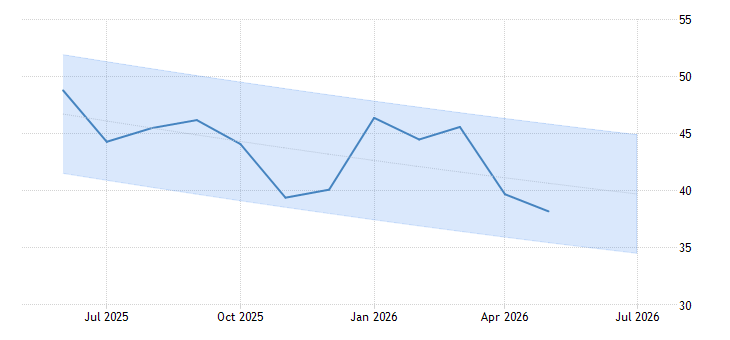
4:30pm GBP Construction PMI
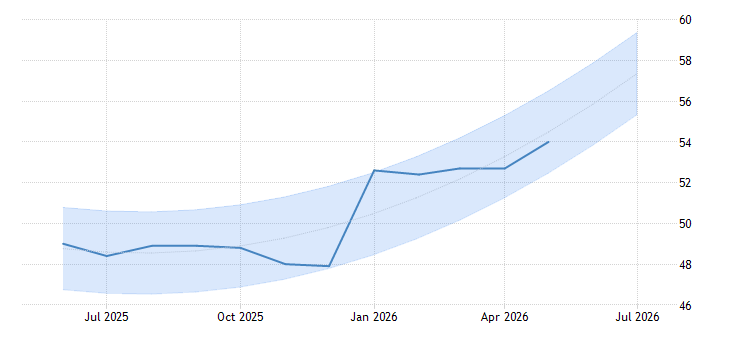
10:00pm USD ISM Manufacturing PMI
Thu Jan 4 2:00am USD FOMC Meeting Minutes
1) GOLD chúng ta canh Sell tại UpperBand M5 và phải có tín hiệu đảo chiều để vào Sell (của Kẽm là chử V ngược), Stoploss 30-50pip TP Fibo 1300
Canh Buy trực tiếp khi tin ra FOMC giá giảm mạnh về chạm VMA3 D1, stoploss 30-50pip TP giá mở cửa hôm nay 1317.5
Nếu giá di chuyển từ từ mới chạm VMA3 D1 thì chúng ta mới mở M5 tìm tín hiệu đảo chiều để vào Buy (của Kẽm là chử V) Stoploss 30-50pip TP giá mở cửa hôm nay 1317.5
2) USDJPY chúng ta canh Buy tại đáy màn hình M5 và phải có tín hiệu đảo chiều (của Kẽm là chử V) Stoploss 30-50pip TP VMA3 D1
Chúng ta sẽ canh vào khoảng thời gian 17h30 – 22h30 khi màn hình co hoặc giãn tạo đỉnh đáy M5 khi ấy chúng ta sẽ vào Buy hoặc Sell khi xuất hiện chử V tại đỉnh đáy màn hình MT4 của các cặp tiền, stoploss dưới đáy màn hình nếu Buy và trên đỉnh màn hình nếu Sell, TP xa trên đỉnh hoặc đáy màn hình.
Bạn có thể tham khảo phương pháp trade qua các bài viết để nắm rõ
Đăng ký kênh của Kẽm Vui Vẻ tại đây : https://goo.gl/6yaQXA
Follow Twitter : https://twitter.com/vodaykem
Follow Facebook : https://www.facebook.com/kemvuive
Tham gia Group để thảo luận: https://www.facebook.com/groups/kemvuive/
Hãy luôn online để refesh website cùng cập nhật trạng thái với Kẽm và nhớ comment dưới YOUTUBE những cặp nào có tín hiệu chử V tại đáy hoặc đỉnh để Kẽm và các bạn cùng xem xét và cùng vào lệnh nhé.Website : https://nguyenphuochai.vn//
Mở TK HotForex: https://www.hotforex.com/?refid=116627
Mở TK Axitrader: https://goo.gl/iTGLce
Mobile : 0908950768 - Zalo - Viber
Không chia sẽ là hủy diệt- Sơn SVT
Tâm trạng không tốt-không trade ; thể trạng không khỏe -không trade
-
11-01-2018 10:35 AM #5
- Ngày tham gia
- Mar 2016
- Đang ở
- https://nguyenphuochai.vn/
- Bài viết
- 2,011
- Được cám ơn 3 lần trong 3 bài gởi
Chiến lược MUA ĐÁY BÁN ĐỈNH ngày 11-1-2018

Những người lãnh đạo thành công có lòng can đảm để hành động khi mà kẻ khác do dự.

Video Chiến lược MUA ĐÁY BÁN ĐỈNH ngày 11-1-2018
https://www.youtube.com/watch?v=uIMTPS8_V6k
Mở tài khoản để trải nghiệm tại ForexTime: https://goo.gl/G8tB6Q
Mở tài khoản Micro để trải nghiệm tại Weltrade: https://goo.gl/DdGNdW
Mở tài khoản để Trade Coin tại Pepperstone: https://goo.gl/e1y30J
Mở tài khoản Axitrader – VSG lần I : https://goo.gl/iTGLce
Mở tài khoản FXPro Master IB VangSaiGon : https://goo.gl/Yz9kk3
Dự báo Tin tức cơ bản hôm nay
07:30 PM EA ECB Monetary Policy Meeting Accounts
8:30pm USD PPI m/m

8:30pm USD Unemployment Claims

1) GOLD chúng ta canh Buy ngay tại LowerBand H4 , đương nhiên phải chờ chử V xuất hiện tại M5 , Stoploss 30-50pip TP UpperBand D1 Fibo 23.6 – 38.2
2) USDJPY chúng ta canh Sell tại UpperBand H1-VMA3 H4, mở M5 chờ tín hiệu đảo chiều tại đây (của Kẽm là chử V ngược) Stoploss 30-50pip TP Fibo 8.5
Chúng ta sẽ canh vào khoảng thời gian 17h30 – 22h30 khi màn hình co hoặc giãn tạo đỉnh đáy M5 khi ấy chúng ta sẽ vào Buy hoặc Sell khi xuất hiện chử V tại đỉnh đáy màn hình MT4 của các cặp tiền, stoploss dưới đáy màn hình nếu Buy và trên đỉnh màn hình nếu Sell, TP xa trên đỉnh hoặc đáy màn hình.
Bạn có thể tham khảo phương pháp trade qua các bài viết để nắm rõ
Đăng ký kênh của Kẽm Vui Vẻ tại đây : https://goo.gl/6yaQXA
Follow Twitter : https://twitter.com/vodaykem
Follow Facebook : https://www.facebook.com/kemvuive
Tham gia Group để thảo luận: https://www.facebook.com/groups/kemvuive/
Hãy luôn online để refesh website cùng cập nhật trạng thái với Kẽm và nhớ comment dưới YOUTUBE những cặp nào có tín hiệu chử V tại đáy hoặc đỉnh để Kẽm và các bạn cùng xem xét và cùng vào lệnh nhé.Website : https://nguyenphuochai.vn//
Mở TK HotForex: https://www.hotforex.com/?refid=116627
Mở TK Axitrader: https://goo.gl/iTGLce
Mobile : 0908950768 - Zalo - Viber
Không chia sẽ là hủy diệt- Sơn SVT
Tâm trạng không tốt-không trade ; thể trạng không khỏe -không trade
-
18-01-2018 08:48 AM #6
- Ngày tham gia
- Mar 2016
- Đang ở
- https://nguyenphuochai.vn/
- Bài viết
- 2,011
- Được cám ơn 3 lần trong 3 bài gởi
Chart Art: Daily Chart Setups on USD/JPY and EUR/CAD
Wakey wakey, pips and trading! Whether you like trading the majors or the crosses, I got yo back with these daily charts on USD/JPY and EUR/CAD. Check ’em out!
First up is a nice countertrend play on USD/JPY. As you can see, the pair just bounced from the 110.00 psychological handle, which lines up with a falling channel support on the daily time frame.
Stochastic is chillin’ like a villain in oversold territory, so y’all should watch out for more bulls coming in and possibly pushing the Greenback up to the 113.00 previous highs.
Not everyone can make countertrend trades, however. Make sure you’re mentally prepared to go against the trend!
EUR/CAD is having trouble breaking above the 1.5150 psychological handle, which isn’t surprising since it lines up with a rising triangle resistance on the daily chart.
Stochastic is currently favoring the bears with an overbought signal, which means that the pair could dip to 1.4950 – 1.5000 before seeing another bullish pressure.
Will the resistance hold for another day? Or will the bulls finally hustle enough muscle to hit highs not seen since February 2016? Watch this one closely, brothas!
Forex Chart Settings:
Slow Stochastic: 14,3,3
100 SMA: Blue line
200 SMA: Red line
Chiến lược giao dịch với Stochastic Oscillator
Code:http://chienluoc100pip.com/chien-luoc-giao-dich-voi-stochastic-oscillator/
Website : https://nguyenphuochai.vn//
Mở TK HotForex: https://www.hotforex.com/?refid=116627
Mở TK Axitrader: https://goo.gl/iTGLce
Mobile : 0908950768 - Zalo - Viber
Không chia sẽ là hủy diệt- Sơn SVT
Tâm trạng không tốt-không trade ; thể trạng không khỏe -không trade
-
23-01-2018 06:11 PM #7
- Ngày tham gia
- Mar 2016
- Đang ở
- https://nguyenphuochai.vn/
- Bài viết
- 2,011
- Được cám ơn 3 lần trong 3 bài gởi
Website : https://nguyenphuochai.vn//
Mở TK HotForex: https://www.hotforex.com/?refid=116627
Mở TK Axitrader: https://goo.gl/iTGLce
Mobile : 0908950768 - Zalo - Viber
Không chia sẽ là hủy diệt- Sơn SVT
Tâm trạng không tốt-không trade ; thể trạng không khỏe -không trade


 Trích dẫn


Thông tin của chủ đề
Users Browsing this Thread
Có 1 thành viên đang xem chủ đề này. (0 thành viên và 1 khách vãng lai)
Similar Threads
-
Phân tích thị trường mỗi ngày cùng instaforex!
By InstaForex Dane in forum Forex và Hàng hóaTrả lời: 54Bài viết cuối: 08-06-2018, 01:53 PM -
Report Phân tích Cung cầu.... & Tín hiệu BBs.... hàng ngày....!!!!
By mayhong in forum Nhận định Thị trườngTrả lời: 17Bài viết cuối: 09-03-2010, 03:04 PM
 Quyền viết bài
- Bạn Không thể gửi Chủ đề mới
- Bạn Không thể Gửi trả lời
- Bạn Không thể Gửi file đính kèm
- Bạn Không thể Sửa bài viết của mình

Bookmarks