


Threaded View
-
13-04-2017 10:42 AM #11
- Ngày tham gia
- Mar 2016
- Đang ở
- https://nguyenphuochai.vn/
- Bài viết
- 2,011
- Được cám ơn 3 lần trong 3 bài gởi

I’m serving up an Aussie + channel pattern double special in today intraday’s charts update, with AUD/USD and AUD/NZD in focus. Check ’em out!
AUD/USD: 1-Hour
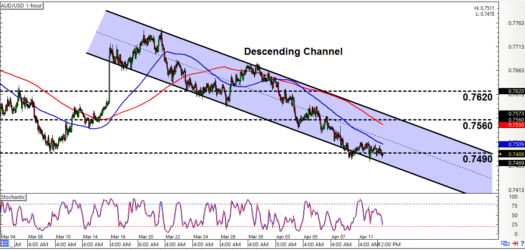
As y’all can see on that there chart, AUD/USD has been trending lower while bouncing up and down inside a descending channel.
We’re still expecting the pair to move lower. Presently, however, the pair seems to have found buyers close to the channel’s support area, which happens to line up rather nicely with the area of interest at 0.7490. Moreover, stochastic is just about to enter oversold territory. There’s therefore a good chance that the pair may move back up again sooner or later.
And if the pair does move back up again, then bulls will likely be gunning for 0.7560 or thereabouts. And really gangsta forex traders can try and ride a potential upswing. Going long here is a counter-trend play and extra risky, though, so more conservative forex traders may wanna sit this one out and wait for a pullback to the channel’s resistance area before going short.
And while an upside channel breakout seems rather unlikely at this point, y’all should know that if the pair stages an upside breakout and smashes past the area of interest at 0.7620, then bulls are likely in command. In that case, y’all may wanna consider bailing your shorts or even switching directional bias. Know what I’m sayin?
AUD/NZD: 1-Hour
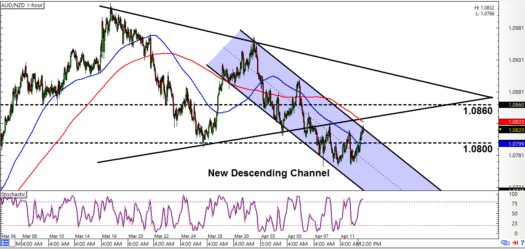
Back on April 5, we had a symmetrical triangle for AUD/NZD, which y’all can still see on that there chart. And as y’all can also see, the pair did stage a downside breakout.
However, buyers appear to have entrenched themselves at 1.0800, since any attempts to smash past that key level have been faded by them bulls. The pair has been making lower higher and lower lows, though, so them bears appear to have an upper hand.
Moreover, if we connect the most recent peaks and troughs, we get that there fresh descending channel to play with. And presently, the pair is testing the channel’s resistance area. Y’all therefore better start lookin’ for opportunities to go short. And all the more so, given that stochastic is already signaling overbought conditions and all that.
Just note that if the pair continues climbing higher on strong momentum and smashes past 1.0860, then it’s game over for the shorts. You see, a breach past that invalidates both the descending channel and the triangle breakout. In any case, just make sure to practice proper risk management as always, a’ight?
Forex Chart Settings:
Slow Stochastic: 14, 3, 3
100 SMAs: Blue line
200 SMA: Red lineWebsite : https://nguyenphuochai.vn//
Mở TK HotForex: https://www.hotforex.com/?refid=116627
Mở TK Axitrader: https://goo.gl/iTGLce
Mobile : 0908950768 - Zalo - Viber
Không chia sẽ là hủy diệt- Sơn SVT
Tâm trạng không tốt-không trade ; thể trạng không khỏe -không trade


 Trích dẫn
Thông tin của chủ đề
Users Browsing this Thread
Có 1 thành viên đang xem chủ đề này. (0 thành viên và 1 khách vãng lai)
Similar Threads
-
Phân tích thị trường mỗi ngày cùng instaforex!
By InstaForex Dane in forum Forex và Hàng hóaTrả lời: 54Bài viết cuối: 08-06-2018, 01:53 PM -
Report Phân tích Cung cầu.... & Tín hiệu BBs.... hàng ngày....!!!!
By mayhong in forum Nhận định Thị trườngTrả lời: 17Bài viết cuối: 09-03-2010, 03:04 PM
 Quyền viết bài
- Bạn Không thể gửi Chủ đề mới
- Bạn Không thể Gửi trả lời
- Bạn Không thể Gửi file đính kèm
- Bạn Không thể Sửa bài viết của mình

Bookmarks